|
Global Discovery of Adaptive Mutations
Abstract
While modern DNA sequencing enables rapid identification of genetic variations, determining the phenotypic consequences of individual mutations remains a highly labor-intensive task. To address this challenge, we developed a technology termed ADAM, for Array-based Discovery of Adaptive Mutations, which searches an entire bacterial genome for mutations that contribute to selectable, phenotypic variation between an evolved strain and its ancestor. ADAM performs a parallel, whole-genome linkage analysis using a library in the evolved background where each strain carries a random, flagged genomic replacement from the parental strain. Growth under selective conditions puts the library strains lacking any of the adaptive mutations at a comparative disadvantage, resulting in the depletion of markers in their chromosomal regions. We show that the computational analysis of these genome-wide depletion values reveals the locations of adaptive mutations in laboratory evolved Escherichia coli strains with high sensitivity and specificity.
Whole-genome depletion scores
CmlR cassette insertion in lacZ
ASN*: Rapid growth on asparagine as the sole source of carbon
ETM: Ethanol tolerant strain
Tools
Perl Scripts
|
quantize_adam_ratios.pl
|
Quantizes the depletion scores into 4 bins.
|
draw_significant_region.pl
|
Draws the depletion scores in a region as a bar graph.
|
remove_noise.pl
|
Removes the noise from depletion scores through filtering and guassian-weighted averaging
|
draw_piechart.pl
|
Draws the depletion scores across the genome as a pie chart with slices of 25 genes each.
|
Programs
For finding the multi-loci regions with high depletion scores, we use iPAGE with the following files as "gonamesfile" and "goindexfile" options. These files provide the spatial profiles which tile the genome with a window consisting 25 consecutive genes.
Download the ADAM package inclucing all the tools, data files and essential files.
Minitutorial
Data presentation
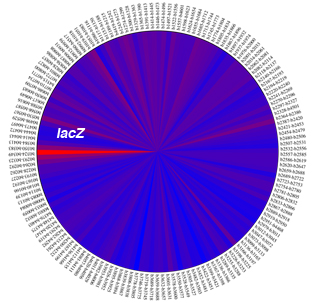
Here, we showcase the steps taken to analyse the whole-genome depletion scores. For this, you need to download the ADAM package (above) and also iPAGE software. We use the raw depletion scores for the CmlR data. This datafile is stored in the DATA folder in the ADAM package. Note that our scripts make use of E. coli MG1655 protein table (MG1655.pt) in the ESSENTIALS folder of the ADAM package. If you want to try these scripts on other organisms, you need to replace the content of this file with the protein table of your organism. The figure below shows the raw depletion scores across the genome (note that the figure that you get might be a rotated version of this).
For generating this figure, go to the SCRIPTS folder and type:
perl draw_piechart.pl ../DATA/CmlR/depletion_scores.txt
The script would generate a "piechart.pdf" file in the input folder (in this case CmlR).
As you see, the high signal at the lacZ locus is quite obvious. The depletion scores at this region are shown below:
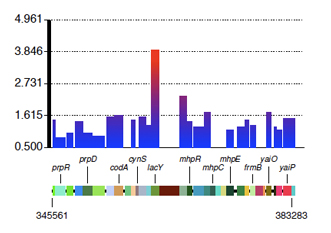
This figure is generated using this command:
perl draw_significant_region.pl ../DATA/CmlR/depletion_scores.txt b0328 b0364
A file titled "result_b0328_b0364.pdf" would be generated in the CmlR folder which contains this figure. Note that the baseline for the depletion scores is 1.0, which denotes no observed changes between the frequency of the markers in the unselected vs. selected samples. Thus, the depletion score of lacY is highly significant.
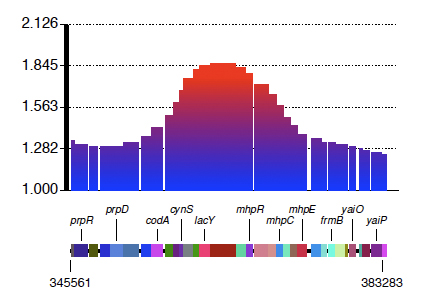
A better presentation, however, can be achieved through noise removal and smoothing. For this, we use this command:
perl remove_noise.pl ../DATA/CmlR/depletion_scores.txt ../DATA/CmlR/depletion_scores_nr.txt ../DATA/Unselected/unselected_zscores.txt
This script generates a "depletion_score_nr.txt" file which contains the smoothed data. Now drawing the lacZ region again would result in the figure below which is much easier to interpret:
Discovering significant loci
In most cases, like the example above, the regions with high scores are simple to find. However, in some cases, the signal comes from a single locus (due to the fitness effect of marker insertions in that gene); whereas, we need to find the types of signal that are generated by many neighboring genes in the region. In order to distinguish these two types and pinpoint multigenic regions, we use a mutual-information based package to identify long stretches of genes that have high depletion score. For this, you need to download iPAGE according to instructions on the webpage.
First, we need to quatize the values into four groups: the top 1% genes, 1-5% genes, 5-10% genes and the rest (as background). Use this command to do this:
perl quatize_adam_ratios.pl --fn=../DATA/CmlR/depletion_scores.txt --outfile=../DATA/CmlR/depletion_scores.q
Then go to the iPAGE folder and type this command:
perl $PAGEDIR/page.pl --expfile=../DATA/CmlR/depletion_scores.q --goindexfile=../ESSENTIALS/gene_order_index.txt --gonamesfile=../ESSENTIALS/gene_order_names.txt --exptype=discrete --max_p=0.0001
Remember that you need to set $PAGEDIR, either through:
export PAGEDIR=the_directory_where_you_installed_iPAGE
or
setenv PAGEDIR the_directory_where_you_installed_iPAGE
The result would look like this:
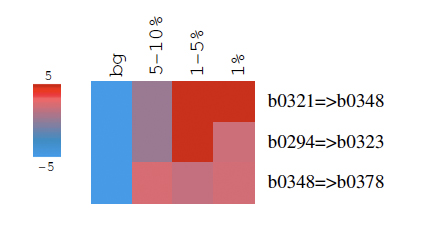
Note that although we find three distinct windows, these windows are in fact neighboring. This means that the genes in the b0294-b0378 are enriched in top scores with b0321-b0348 with the highest enrichment (note that lacZ is b0344).
|
