iPAGE Graphical User Interface
iPAGE is a mutual-information based program for an efficient modular analysis of whole-genome datasets. It can handle both discrete (e.g. cluster indices) and continuous (e.g. z-scores) values. Its built-in redundancy removal approach ensures a concise list of independent categories which is presented through a modifiable heatmap.
Requirements
iPAGE GUI binaries are available for Microsoft Windows and Apple Mac platforms. No installation is necessary -- simply extract the archive into a directory, while ensuring that the directory path does not have spaces. For both platforms, perl is required and should be installed before proceeding.
You can test for perl presence by opening a console or terminal window (e.g., Terminal or Start->Run->cmd) and running "perl --version". 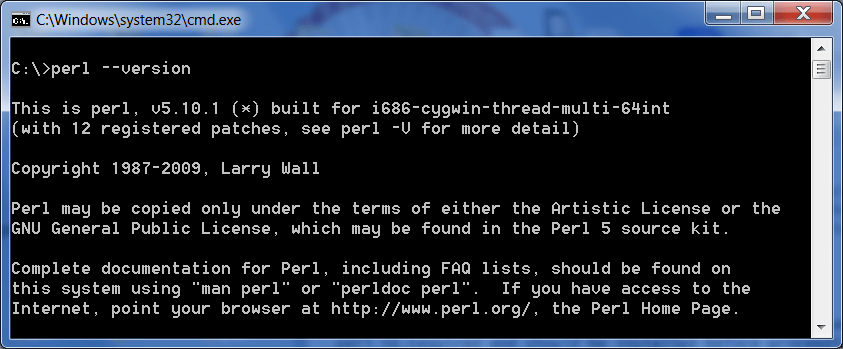
If no version number is displayed, please install perl. For Microsoft Windows, one may download the MSI version of ActivePerl, install it, and try again. For Apple Mac, one may install the set of developer tools.
For other platforms, the Qt source for the GUI component is available for use.
Running iPAGE
- Go to the directory where you have extracted iPAGE. Directory paths that include spaces (e.g., Documents and Settings) are not supported. For Apple Mac users, please ensure that the iPAGE directory has both read and write access from your account (e.g., right-click on the directory, Get Info, Sharing and Permissions).
-
Run "iPAGE_GUI".
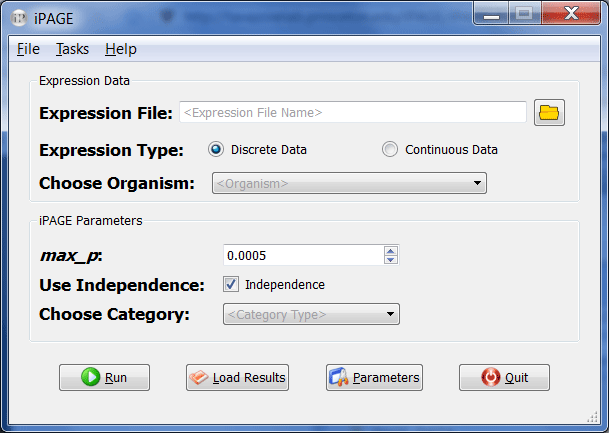
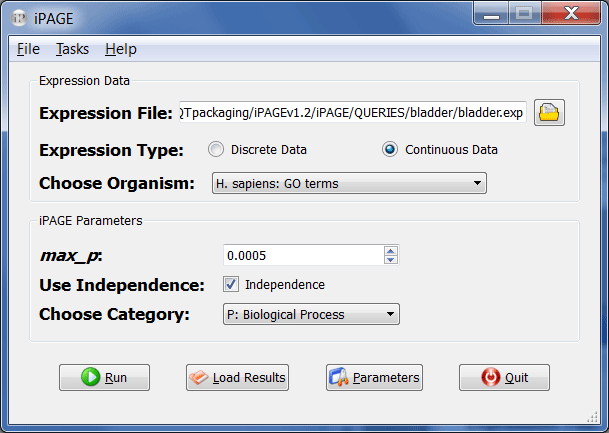
- Choose your expression file and select whether it contains discrete or continuous values. For example, open "bladder.exp" from the QUERIES/bladder folder in the iPAGE directory and set the expression type to "continuous". Directory paths that include spaces (e.g., Documents and Settings) are not supported.
- Next, choose the organism you are working with. The data in "bladder.exp" comes from human, so choose one of the categories belonging to H. sapiens from the drop-down combo box (e.g., H. sapiens: GO terms).
-
In the iPAGE parameters section choose "Biological Process" in "Choose Category" and leave the "Independence" option checked.
-
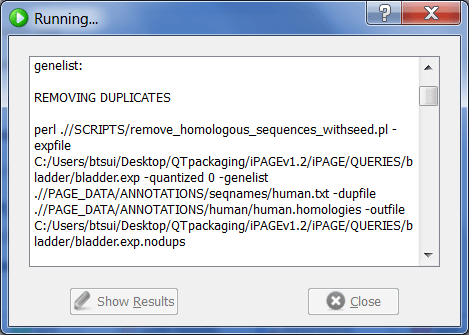
Now click "Run". A console window may appear while iPAGE is running.
-
Upon the completion of the run, the show results button becomes active and can be clicked to show the results page.
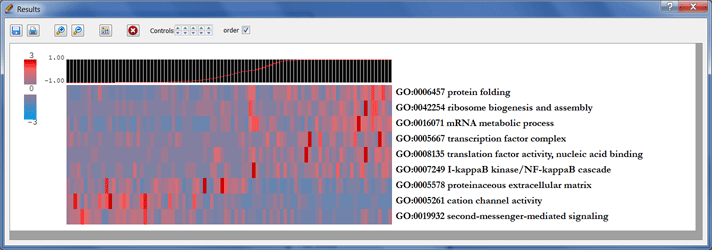
-
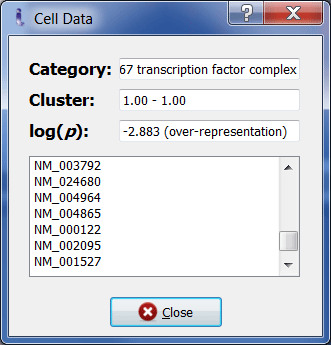
Double clicking on each element opens a window containing information about the category, its cluster, its corresponding p-value, and its relevant genes.
- Clicking on the palette icon enables you to change the colormap. The results may also be saved as a PDF file or printed for reference.
Loading results
- In the iPAGE main page, select the expression file.
- Click on "Load Results" and the GUI will look in expressionfile_PAGE directory to open the results. If you have moved or deleted this directory you will see an error message.